This post focuses on implementing a simple form of Bottom-Up Budgeting with IBM Planning Analytics, here is our earlier Overview of Bottom-Up Budgeting
Planning analytics leverages the existing Actuals reporting to make Bottom Up Budgeting a simple enhancement. Template views or Excel sheets enables budget holders to input department level values which are automatically consolidated into a high-level view for upper management.
To highlight a bottom-up budget we are going to use a profit and Loss cube which holds data by version, period, years, regions, chart of account line and measures:
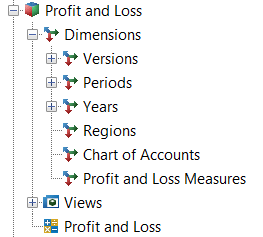
In the Profit and Loss model we hold data by 10 separate regions, we will be setting the budget for each Region (but this could also be by Cost Centre, Product Group, Asset Type) via an input sheet. As each department is producing a detailed budget we are expecting managers to input values across each month (this could be to facilitate seasonal variations or peak/ off-peak periods throughout the year).

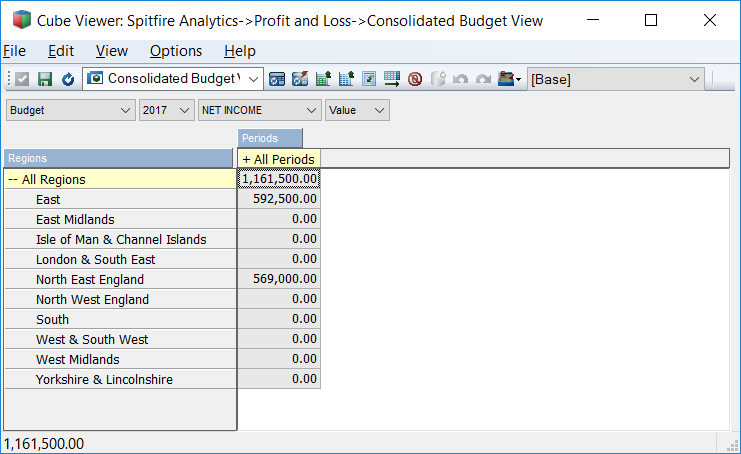
As users input the values per month against account lines then the consolidation “All Periods” is automatically updated with totals for the year. By the same token all values input against each Region (East in this case) will also automatically be consolidated into “All Regions”.
I can input values directly into the Cube Viewer or I can Slice my values to excel and input directly in excel.
However, for simplicity I have developed a simple application to help me with my Bottom Up Budgeting tasks:
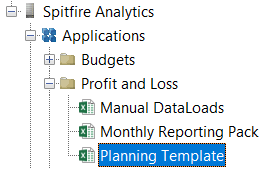
The “Planning Template” application is hosted on the TM1 Server and contains live links to the data held on TM1, any changes made in the application will reflect in the Cube Viewer and any other TM1 clients you care to use.
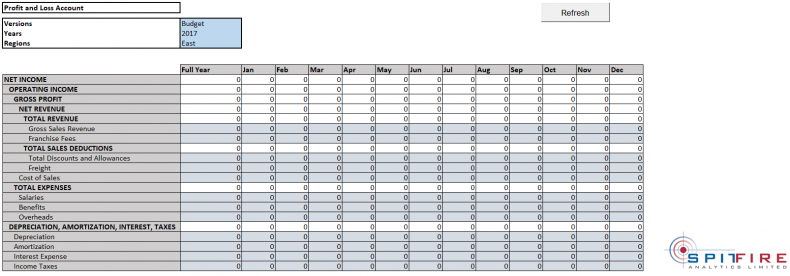
We can select the Versions, Years, Regions that we want to interact with. In this instance I have selected the “Budget” version and the Year “2017” alongside the Region “East”.
From the template we can input values for the base elements in our chart of accounts (we call them base level or N level elements as they are the lowest level in the hierarchy that is our Chart of Accounts).
If automatic calculation is turned on in Excel then we should immediately see Full Year values updating in our template view. Alternatively, if manual calculation mode is on then press F9 to recalculate or select the “Refresh” button which performs the same action.
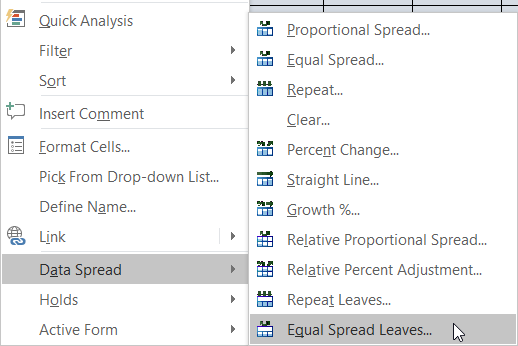
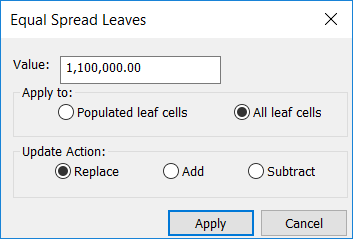
If we want to equally spread a value across all months of the year then we can utilise data spreading to increase our efficiency. We can either right click on the Full Year cell > Select Data Spread > Select Equal Spread Leaves
From the resulting window input the Full Year value to be spread, whether to spread over populated cells or all cells (in this case All leaf cells) and select Replace as the update action.
We can now see that the 1.1 million Gross Sales Revenue we have input has been equally spread across all months and is consolidating into Full Year.

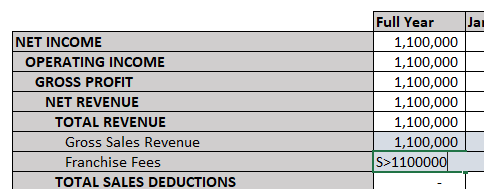
Alternatively, utilise the data spreading shortcuts available in Planning Analytics (https://www.ibm.com/support/knowledgecenter/SSD29G_2.0.0/com.ibm.swg.ba.cognos.tm1_ug.2.0.0.doc/c_quickreferencetable_n60dc9.html#QuickReferenceTable_N60DC9) to achieve the same goal
In future posts we will look at approval processes and submitting budgets as part of the budgeting cycle.
Spitfire Analytics:
We are a team of finance professionals – who are experts in helping companies bring efficiency, speed, and agility to their finance teams and planning processes.
As a team we have over 35 years of experience in licencing, designing, implementing, and delivering systems to improve the planning, budgeting, forecasting, and analysis processes. We do this using IBM Planning Analytics (powered by TM1).
We currently offer a free health check of your planning system – regardless of what software you use.
Should you already have a project in mind, want to learn more about us and our services, or arrange a health check; please contact us on 0161 464 3687 or email [email protected]
